From Sounding Poles to Side Scan Sonar, a nice history of depth measurements for marine charts & why some of the depths on your charts were last checked 100 years ago. And finding reliable data for the Arctic Ocean as it opens up for navigation.
And yes, NOAA still uses Lead Lines today for some depth measurments.
Alaska’s nautical charts need to be updated — we all know that. The diagram below shows the vintage of survey data currently used for today’s charts in Alaska. The graphic includes all surveys done by NOAA’s Office of Coast Survey (and its predecessors), and some limited data acquired by other agencies, i.e., the U.S. Coast Guard. Areas that are not colored in have never been surveyed or have data acquired by another source — from Russia or Japan, for instance — before the U.S. was responsible for charting in that area.
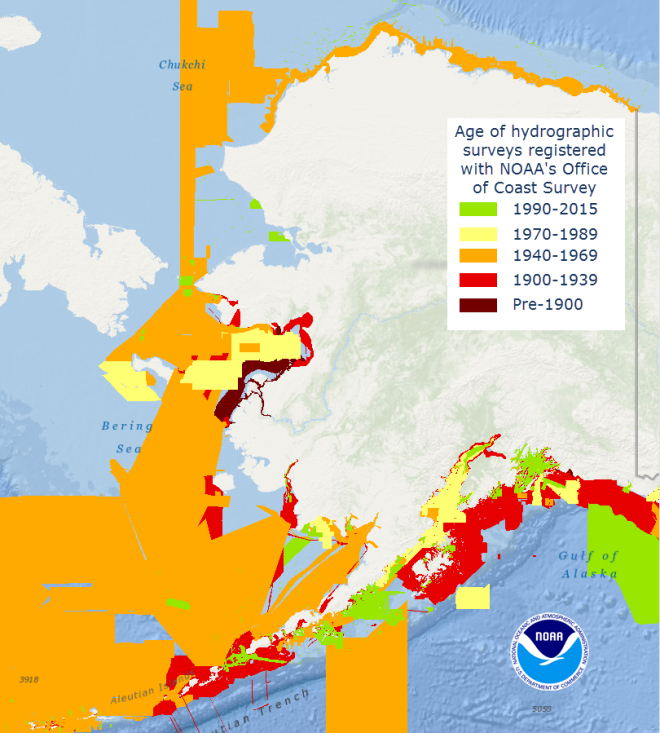
What are the differences between data collected in 1900, 1940, or 1960? Let’s take a look at a…
Brief Historical Sketch of Survey Technologies
Nautical charts have a lot of information, but mariners especially are concerned with two major components: water depths (known as “soundings”) and obstructions (like underwater seamounts or wrecks).
Different eras used different technologies to find, measure, and…
View original post 1,356 more words


